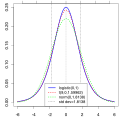
logistic.t.norm = function(xmin, xmax, yplot.max, filename) {
# Generate npoints from xmin to xmax
npoints=10000
scalefact=npoints/(xmax - xmin)
x=(xmin*scalefact):(xmax*scalefact)/scalefact

ylim=c(0,yplot.max) # Minimum and maximum Y limits
svg(filename)
# cex=font scaling, mai=margins (reduced as much as possible)
par(cex=1.5,mai=c(0.8,0.8,0.2,0.1))
# Plot blue logistic curve; lwd=line width, type="l" means use a line
plot(x,dlogis(x),type="l",xlab="", ylab="",lwd=3,col="blue",ylim=ylim)
abline(v=0,lty=3) # Draw a dotted vertical line at 0 (lty=line type, 3=dotted)
# Set Student t params to match moments of logistic
df = 9; shape = sqrt((df-2)/df*pi*pi/3)
# Plot red Student t curve; lwd=line width, lty=line type (3=dotted)
points(x,dt(x/shape,df)/shape,type="l",lty=3,col="red",lwd=3)
# Set normal params to match moments of logistic
sd = sqrt(pi*pi/3)
# Draw std dev lines (currently only at +/- 1 std dev, alternatively at all of them)
#for (sdevs in 1:floor(xmax/sd)) {
for (sdevs in 1:1) {
  abline(v=-sd*sdevs,lty=2) # Draw a dashed vertical line at -1 std dev (lty 2=dashed)
  abline(v=sd*sdevs,lty=2) # Draw a dashed vertical line at +1 std dev (lty 2=dashed)
}
# Add std dev ticks along the top
axis(3,at=-floor(xmax/sd):floor(xmax/sd)*sd,labels=FALSE)
# Plot green normal curve; lwd=line width, lty=line type (3=dotted)
points(x,dnorm(x,0,sd),type="l",lty=3,col="green",lwd=3)
# Draw legend in bottom center
legend("bottom", c("logistic(0,1)", sprintf("t(%g,0,%g)",df,shape), sprintf("norm(0,%g)", sd), sprintf("std dev=%g", sd)), cex=0.9,col = c("blue","red","green", "black"), lty=c(1,3,3,2),lwd=c(3,3,3,1))
dev.off()
}

logistic.t.norm(-6,6,0.25,"logistic-t-normal.svg")


