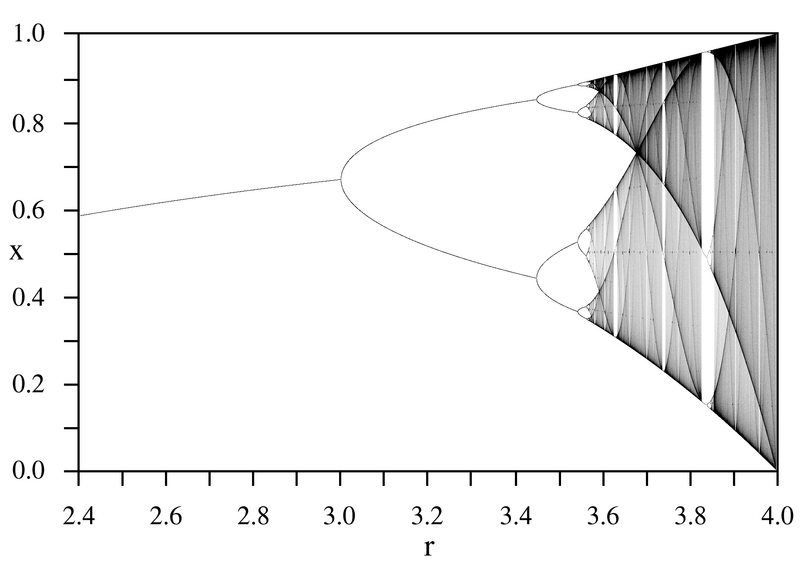
File:LogisticMap BifurcationDiagram.png
外观

本预览的尺寸:800 × 566像素。 其他分辨率:320 × 226像素 | 640 × 453像素 | 1,024 × 724像素 | 1,280 × 905像素 | 1,838 × 1,300像素。
原始文件 (1,838 × 1,300像素,文件大小:571 KB,MIME类型:image/png)
文件历史
点击某个日期/时间查看对应时刻的文件。
| 日期/时间 | 缩略图 | 大小 | 用户 | 备注 | |
|---|---|---|---|---|---|
| 当前 | 2005年9月14日 (三) 00:11 |  | 1,838 × 1,300(571 KB) | PAR~commonswiki | Bifurcation diagram for the logistic map for parameter r=2.4 to 4.0. |
文件用途
以下5个页面使用本文件:
全域文件用途
以下其他wiki使用此文件:
- ar.wikipedia.org上的用途
- ca.wikipedia.org上的用途
- da.wikipedia.org上的用途
- de.wikipedia.org上的用途
- el.wikipedia.org上的用途
- en-two.iwiki.icu上的用途
- Talk:Bifurcation diagram
- Talk:Logistic map
- Mitchell Feigenbaum
- Portal:Mathematics/Featured picture archive
- Recurrence quantification analysis
- Portal:Mathematics/Suggestions
- Wikipedia:WikiProject Systems/List of images of systems
- User:Kiefer.Wolfowitz
- Ivar Ekeland
- Wikipedia talk:WikiProject Mathematics/Archive/2011/Apr
- User talk:Kiefer.Wolfowitz/Archive 9
- Portal:Mathematics/Featured picture/2011 12
- User:RazrRekr201/Table of constants
- Mathematical constant
- en.wikibooks.org上的用途
- en.wikiversity.org上的用途
- eo.wikipedia.org上的用途
- es.wikipedia.org上的用途
- fi.wikipedia.org上的用途
- fr.wikipedia.org上的用途
- fr.wikiversity.org上的用途
- he.wikipedia.org上的用途
- hi.wikipedia.org上的用途
查看此文件的更多全域用途。


