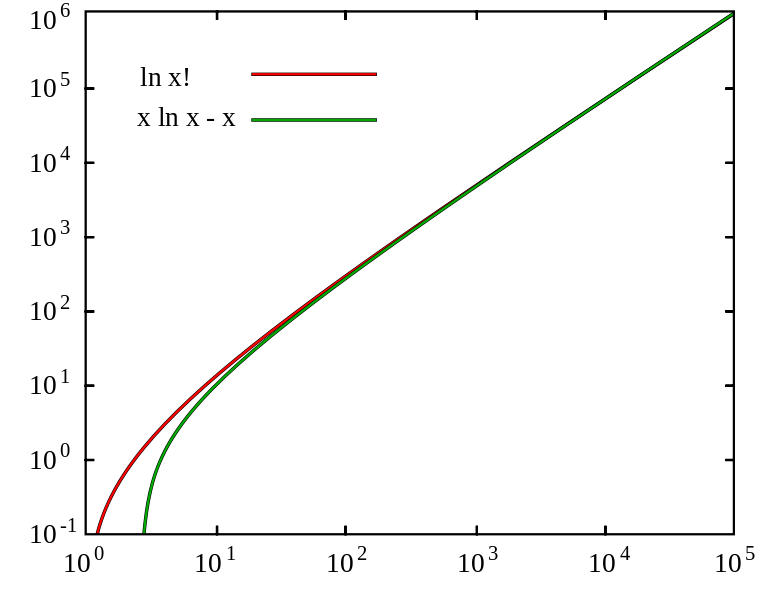
摘要
SVG code
<?xml version="1.0" encoding="utf-8"?>
<!DOCTYPE svg PUBLIC "-//W3C//DTD SVG 1.1//EN" "http://www.w3.org/Graphics/SVG/1.1/DTD/svg11.dtd">
<svg version = "1.1"
     id      = "Stirling_approximation_graph"
     xmlns   = "http://www.w3.org/2000/svg"
     width   = "2700"
     height  = "2100">
<!-- ==================== Data Curves ===================== -->
<g fill="none">
   <path stroke="#000" stroke-width="12" d="M  340,1871 C 440,1470, 960,1110,2567,  50"/>
   <path stroke="#00f" stroke-width="8"  d="M  340,1871 C 440,1470, 960,1110,2567,  50"/>
   <path stroke="#000" stroke-width="12" d="M 2571,  46 C 660,1310, 544,1445, 504,1870"/>
   <path stroke="#f00" stroke-width="8"  d="M 2571,  46 C 660,1310, 544,1445, 504,1870"/>
</g>
<!-- ==================== Legend ===================== -->
<text x="490" y="300" font-size="96">ln x!</text>
<text x="480" y="440" font-size="96">x ln x - x</text>
<polyline stroke="#000" stroke-width="12" points="880,260 1320,260"/>
<polyline stroke="#00f" stroke-width="8"  points="882,260 1318,260"/>
<polyline stroke="#000" stroke-width="12" points="880,420 1320,420"/>
<polyline stroke="#f00" stroke-width="8"  points="882,420 1318,420"/>
<!-- ==================== Y-Axis Labels ===================== -->
<text x="100" y=" 100" font-size="96">10</text> <text x="210" y="  60" font-size="72">6</text>
<text x="100" y=" 340" font-size="96">10</text> <text x="210" y=" 300" font-size="72">5</text>
<text x="100" y=" 600" font-size="96">10</text> <text x="210" y=" 560" font-size="72">4</text>
<text x="100" y=" 860" font-size="96">10</text> <text x="210" y=" 820" font-size="72">3</text>
<text x="100" y="1120" font-size="96">10</text> <text x="210" y="1080" font-size="72">2</text>
<text x="100" y="1380" font-size="96">10</text> <text x="210" y="1340" font-size="72">1</text>
<text x="100" y="1640" font-size="96">10</text> <text x="210" y="1600" font-size="72">0</text>
<text x="100" y="1900" font-size="96">10</text> <text x="210" y="1860" font-size="72">-1</text>
<!-- ==================== X-Axis Labels ===================== -->
<text x="220 " y="2000" font-size="96">10</text> <text x="330 " y="1960" font-size="72">0</text>
<text x="680 " y="2000" font-size="96">10</text> <text x="790 " y="1960" font-size="72">1</text>
<text x="1140" y="2000" font-size="96">10</text> <text x="1250" y="1960" font-size="72">2</text>
<text x="1600" y="2000" font-size="96">10</text> <text x="1710" y="1960" font-size="72">3</text>
<text x="2060" y="2000" font-size="96">10</text> <text x="2170" y="1960" font-size="72">4</text>
<text x="2500" y="2000" font-size="96">10</text> <text x="2610" y="1960" font-size="72">5</text>
<!-- ================= Axes & Tick Marks ================== -->
<polygon fill="none" stroke="#000" stroke-width="8" points="
    300,  40   300, 310   330, 310   300, 310   300, 570   330, 570   300, 570
               300, 830   330, 830   300, 830   300,1090   330,1090   300,1090
               300,1350   330,1350   300,1350   300,1610   330,1610   300,1610
    300,1870   760,1870   760,1840   760,1870  1210,1870  1210,1840  1210,1870
              1670,1870  1670,1840  1670,1870  2120,1870  2120,1840  2120,1870
   2570,1870  2570,1610  2540,1610  2570,1610  2570,1350  2540,1350  2570,1350
              2570,1090  2540,1090  2570,1090  2570, 830  2540, 830  2570, 830
              2570, 570  2540, 570  2570, 570  2570, 310  2540, 310  2570, 310
   2570,  40  2120,  40  2120,  70  2120,  40  1670,  40  1670,  70  1670,  40
              1210,  40  1210,  70  1210,  40   760,  40   760,  70   760,  40"/>
</svg>

W3C-validity not checked.
添加一行文字以描述该文件所表现的内容


