
File:TaylorCosAllSVG.svg

此SVG文件的PNG预览的大小:680 × 600像素。 其他分辨率:272 × 240像素 | 544 × 480像素 | 870 × 768像素 | 1,161 × 1,024像素 | 2,321 × 2,048像素。
原始文件 (SVG文件,尺寸为680 × 600像素,文件大小:1.37 MB)
摘要
| 描述 |
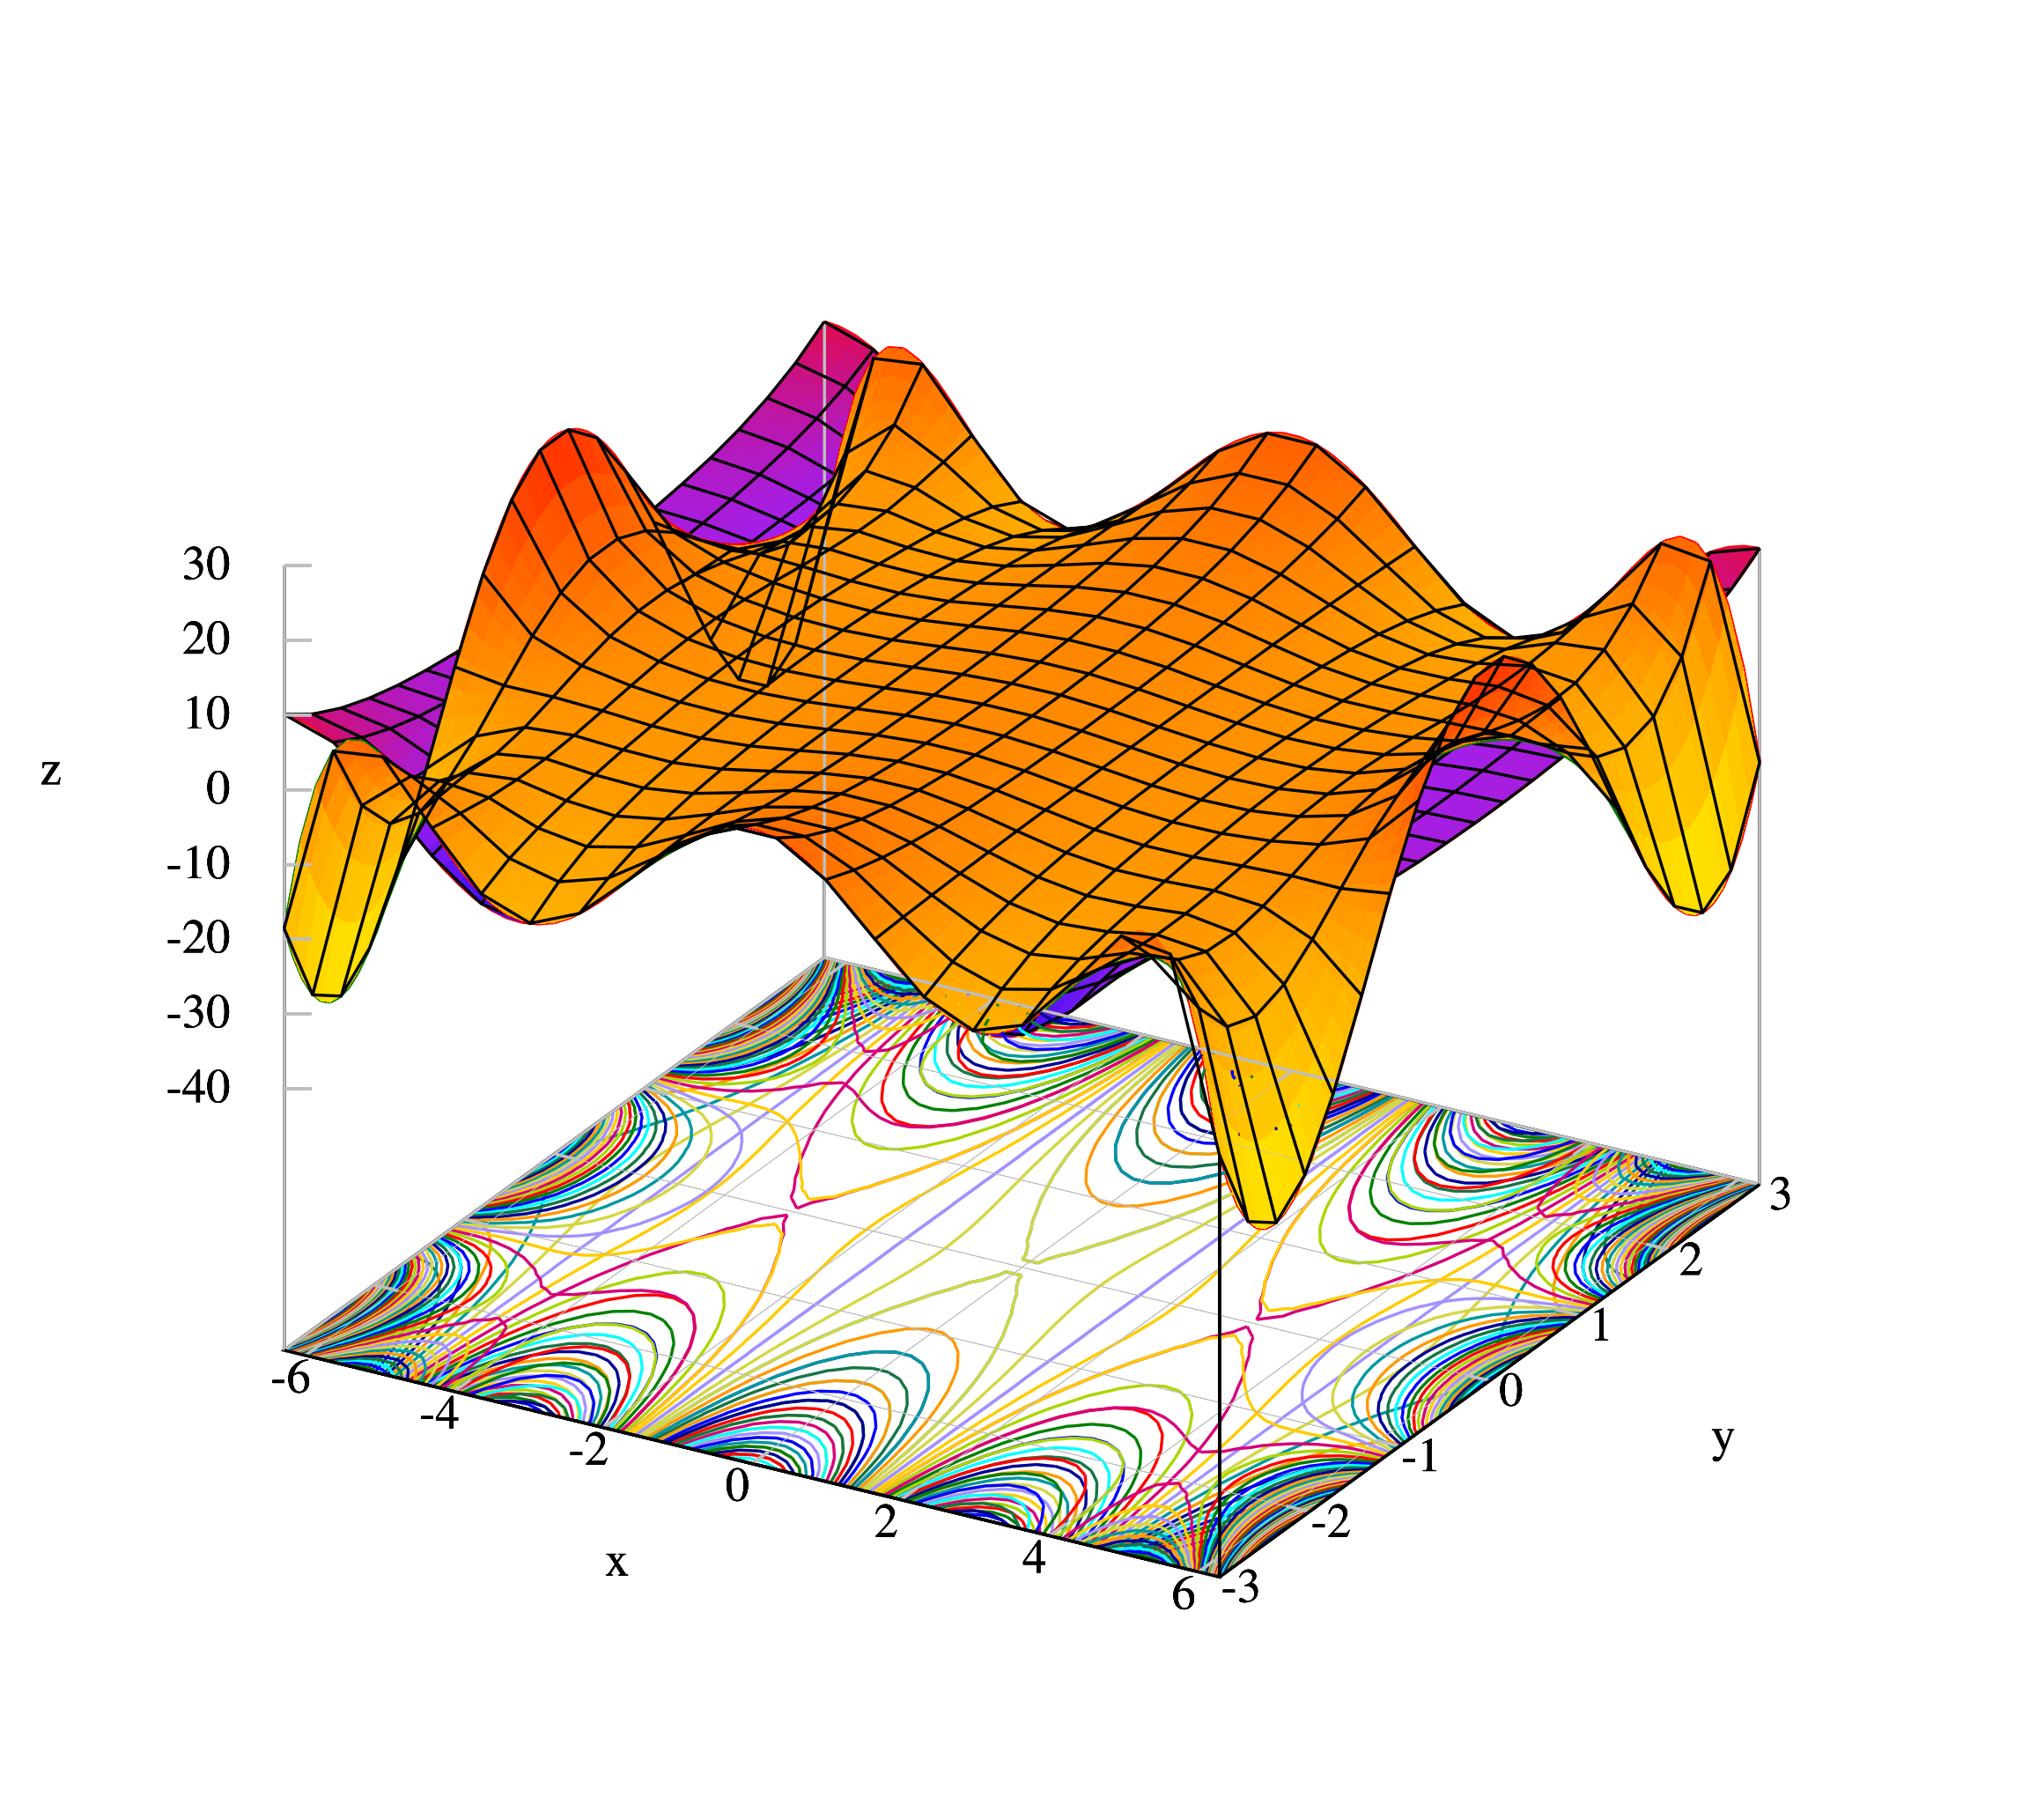
English: SVG edition for z=Re(cos(x+iy)) and its 8-degree Taylor expansion. |
| 日期 | |
| 来源 | 自己的作品 |
| 作者 | IkamusumeFan |
Generated by Gnuplot.
许可协议
我,本作品著作权人,特此采用以下许可协议发表本作品:
本文件采用知识共享署名-相同方式共享 3.0 未本地化版本许可协议授权。
- 您可以自由地:
- 共享 – 复制、发行并传播本作品
- 修改 – 改编作品
- 惟须遵守下列条件:
- 署名 – 您必须对作品进行署名,提供授权条款的链接,并说明是否对原始内容进行了更改。您可以用任何合理的方式来署名,但不得以任何方式表明许可人认可您或您的使用。
- 相同方式共享 – 如果您再混合、转换或者基于本作品进行创作,您必须以与原先许可协议相同或相兼容的许可协议分发您贡献的作品。
Gnuplot
set term svg size 680,600 enhanced font 'Times,12'
#set term post eps enhanced color font 'Times,12' linewidth 2
set output 'TaylorCosAllSVG.svg'

set multiplot

set cntrparam levels 100
set contour base
set isosamples 60,60
set samples 60,60
set xlabel "x"
set ylabel "y"
set zlabel "z"
set xrange [-2*pi:2*pi]
set yrange [-3:3]
set zrange [-40:30]
unset colorbox
unset key

# Draw the surface
set pm3d
set hidd
set grid layerdefault linetype -1 linecolor rgb "gray"  linewidth 0.200, linetype -1 linecolor rgb "gray"  linewidth 0.200
set palette defined (-1 "blue", 0 "purple", 1 "red")
i = {0.0,1.0}
splot real(cos(x+i*y))
# Draw the lines
unset cntrparam
unset contour
unset pm3d
unset hidd
set isosamples 20,20
set samples 20,20
splot real(cos(x+i*y)) lt rgb "black"

# Draw the surface
set zrange [-40:30]
set cntrparam levels 100
set contour base
set isosamples 60,60
set samples 60,60
set pm3d
set hidd
set grid layerdefault linetype -1 linecolor rgb "gray"  linewidth 0.200, linetype -1 linecolor rgb "gray"  linewidth 0.200
set palette defined (-1 "yellow", 0 "orange", 1 "red")
i = {0.0,1.0}
splot real(1-(x+i*y)**2/2! + (x+i*y)**4/4! - (x+i*y)**6/6! +(x+i*y)**8/8!)
# Draw the lines
unset cntrparam
unset contour
unset pm3d
unset hidd
set isosamples 20,20
set samples 20,20
splot real(1-(x+i*y)**2/2! + (x+i*y)**4/4! - (x+i*y)**6/6! +(x+i*y)**8/8!) lt rgb "black"
set view 29,53

unset multiplot
set term x11
set output
文件历史
点击某个日期/时间查看对应时刻的文件。
| 日期/时间 | 缩略图 | 大小 | 用户 | 备注 | |
|---|---|---|---|---|---|
| 当前 | 2013年7月22日 (一) 11:18 | | 680 × 600(1.37 MB) | IkamusumeFan | User created page with UploadWizard |
文件用途
以下页面使用本文件:
全域文件用途
以下其他wiki使用此文件:
- hi.wikipedia.org上的用途
- hy.wikipedia.org上的用途
- uk.wikipedia.org上的用途