跳至內容

英文维基 | 中文维基 | 日文维基 | 草榴社区

File:1000 Year Temperature Comparison.png

頁面內容不支援其他語言。
這個檔案來自維基共享資源
維基百科,自由的百科全書

1000_Year_Temperature_Comparison.png (599 × 442 像素,檔案大小:32 KB,MIME 類型:image/png


本圖片是以PNG、GIF或JPEG格式上傳。然而,其中包含的資料或訊息,應該重新建立成可縮放向量圖形SVG)檔案,以更有效率或更準確的方式儲存。如有可能,請上傳本圖片的SVG格式版本。在上傳之後,請修改維基各姊妹計畫中所有使用舊版圖片的條目(列在圖像連結章節中),替換為新版圖片,並在舊圖片的描述頁中加入{{Vector version available|新圖片名稱.svg}}模板,同時移除本模板。

摘要

描述
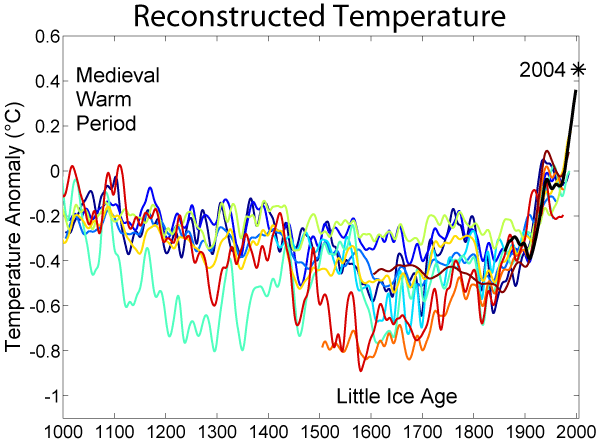
English: This image is a comparison of 10 different published reconstructions of mean temperature changes during the 2nd millennium. More recent reconstructions are plotted towards the front and in redder colors, older reconstructions appear towards the back and in bluer colors. An instrumental history of temperature is also shown in black. The medieval warm period and little ice age are labeled at roughly the times when they are historically believed to occur, though it is still disputed whether these were truly global or only regional events. The single, unsmoothed annual value for 2004 is also shown for comparison. (Image:Instrumental Temperature Record.png shows how 2004 relates to other recent years).

It is unknown which, if any, of these reconstructions is an accurate representation of climate history; however, these curves are a fair representation of the range of results appearing in the published scientific literature. Hence, it is likely that such reconstructions, accurate or not, will play a significant role in the ongoing discussions of global climate change and global warming.

For each reconstruction, the raw data has been decadally smoothed with a σ = 5 yr Gaussian weighted moving average. Also, each reconstruction was adjusted so that its mean matched the mean of the instrumental record during the period of overlap. The variance (i.e. the scale of fluctuations) was not adjusted (except in one case noted below).

Except as noted below, all original data for this comparison comes from here and links therein. It should also be noted that many reconstructions of past climate report substantial error bars, which are not represented on this figure.
日期
來源 http://www.globalwarmingart.com/wiki/File:1000_Year_Temperature_Comparison.png
作者 Robert A. Rohde
其他版本

Reconstructions

The reconstructions used, in order from oldest to most recent publication are:

  1. (dark blue 1000-1991): The Holocene.
  2. (blue 1000-1980): Geophysical Research Letters.
  3. (light blue 1000-1965): Ambio. Modified as published in Science.
  4. (lightest blue 1402-1960): J. Geophys. Res..
  5. (light green 831-1992): Science.
  6. (yellow 200-1980): Geophysical Research Letters. doi:10.1029/2003GL017814.
  7. (orange 200-1995): Reviews of Geophysics. doi:10.1029/2003RG000143
  8. (red-orange 1500-1980): Geophys. Res Lett.. doi:10.1029/2004GL019781
  9. (red 1-1979): Nature. doi:10.1038/nature03265
  10. (dark red 1600-1990): Science. doi:10.1126/science.1107046

(black 1856-2004): Instrumental data was jointly compiled by the Climatic Research Unit and the UK Meteorological Office Hadley Centre. Global Annual Average data set TaveGL2v [1] was used.

Documentation for the most recent update of the CRU/Hadley instrumental data set appears in: Journal of Climate.

授權條款

The original version of this figure was prepared by Robert A. Rohde from publicly available data and is incorporated into the Global Warming Art project.

Image from Global Warming Art
This image is an original work created for Global Warming Art. Please refer to the Year Temperature Comparison.png image description page for more information.
GNU head 已授權您依據自由軟體基金會發行的無固定段落、封面文字和封底文字GNU自由文件授權條款1.2版或任意後續版本,對本檔進行複製、傳播和/或修改。該協議的副本列在GNU自由文件授權條款中。
w:zh:共享創意
姓名標示 相同方式分享
此檔案採用共享創意 姓名標示-相同方式分享 3.0 未在地化版本授權條款。
您可以自由:
  • 分享 – 複製、發佈和傳播本作品
  • 重新修改 – 創作演繹作品
惟需遵照下列條件:
  • 姓名標示 – 您必須指名出正確的製作者,和提供授權條款的連結,以及表示是否有對內容上做出變更。您可以用任何合理的方式來行動,但不得以任何方式表明授權條款是對您許可或是由您所使用。
  • 相同方式分享 – 若要根據本素材進行再混合、轉換或創作,則必須以與原作相同或相容的授權來發布您的作品。
已新增授權條款標題至此檔案,作為GFDL授權更新的一部份。


Notes

  1. Data from Moberg et al. was taken directly from the supplemental information accompanying the Nature article.
  2. Data for Oerlemans was provided by William M. Connolley.
  3. Esper et al. reported only fluctuations in "arbitrary" units, so the variance in this record was rescaled to match the variance during the period of overlap with the instrumental record.
  4. When a paper included multiple reconstructions, the global annually average temperature data was used. If this was not reported, then Northern Hemisphere annually averaged data was used.
  5. Four records appearing at [2] were not used in preparing this graph for the following reasons:
    1. Mann et al. 98 was not included because Mann et al. 99 extended and updated that record.
    2. Briffa et al. 98 was not included because Briffa et al. 2001 extended and updated that record.
    3. Pollack et al. 98 was not included because the reported data was not found to be in a form that allowed for easy replotting.
    4. Mann et al. 2000 was not used because it did not include an original reconstruction covering at least the Northern Hemisphere.


Dragons flight's Temperature Record Series
This figure is part of a series of plots created by Dragons flight to illustrate
changes in Earth's temperature and climate across many different time scales.
Time Period: 25 yrs | 150 yrs | 1 kyr | 2 kyr | 12 kyr | 450 kyr | 5 Myr | 65 Myr | 500 Myr
For articles related to this topic see: Temperature record

說明

添加單行說明來描述出檔案所代表的內容

在此檔案描寫的項目

描繪內容

著作權狀態 繁體中文 (已轉換拼寫)

有著作權 繁體中文 (已轉換拼寫)

多媒體型式 繁體中文 (已轉換拼寫)

image/png

校驗和 繁體中文 (已轉換拼寫)

896104465de636e551cb77de82d0892e1e892551

斷定方法:​SHA-1 中文 (已轉換拼寫)

32,749 位元組

442 像素

599 像素

檔案歷史

點選日期/時間以檢視該時間的檔案版本。

日期/時間縮⁠圖尺寸用戶備⁠註
目前2019年11月21日 (四) 23:14於 2019年11月21日 (四) 23:14 版本的縮圖599 × 442(32 KB)MyridiumSomebody updated the image with a "2016" label that isn't even included in the data analysed! Data analysed only goes up to 2004.
2019年5月5日 (日) 06:54於 2019年5月5日 (日) 06:54 版本的縮圖599 × 500(48 KB)TobusUpdate to show 2016 temperature anomaly
2014年7月16日 (三) 17:10於 2014年7月16日 (三) 17:10 版本的縮圖599 × 442(32 KB)JeffyPShrinkin' the image.
2005年12月17日 (六) 22:51於 2005年12月17日 (六) 22:51 版本的縮圖599 × 442(40 KB)Saperaud~commonswiki*'''Description:''' [[en:Image:{{subst:PAGENAME}}]]

下列2個頁面有用到此檔案:

全域檔案使用狀況

以下其他 wiki 使用了這個檔案: