跳转到内容

英文维基 | 中文维基 | 日文维基 | 草榴社区

File:Mollweide Cycle.gif

页面内容不支持其他语言。
这个文件来自维基共享资源
维基百科,自由的百科全书

Mollweide_Cycle.gif (720 × 360像素,文件大小:4.33 MB,MIME类型:image/gif、​循环、​60帧、​6.0秒)


摘要

描述
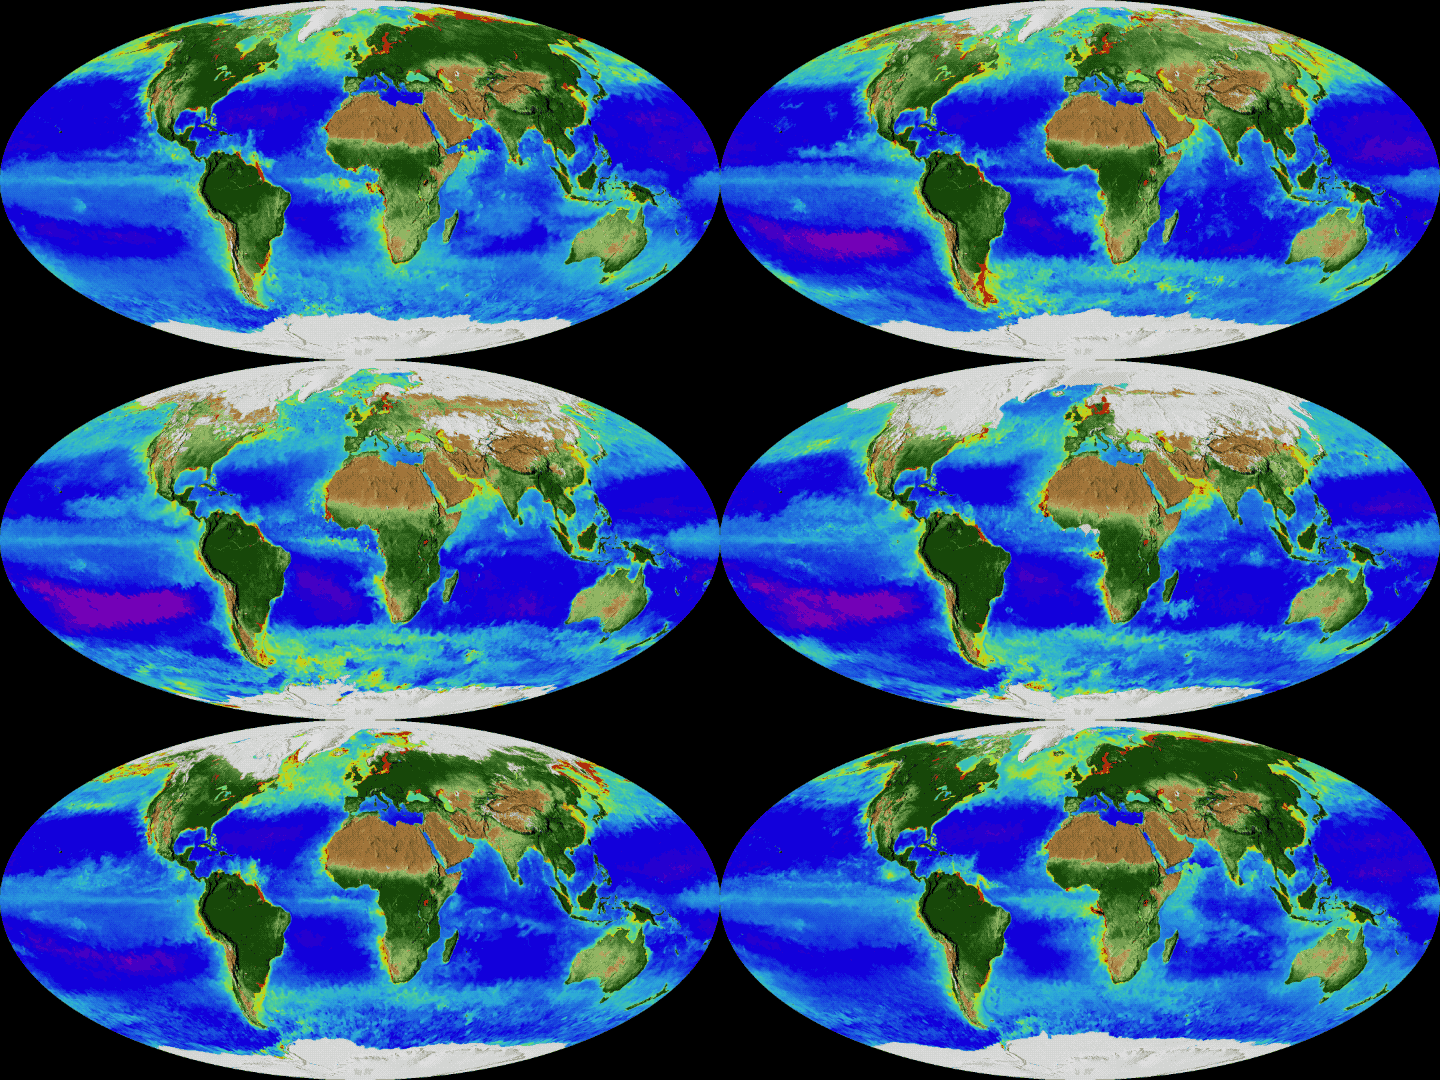
English: On land, vegetation appears on a scale from brown (low vegetation) to dark green (lots of vegetation); at the ocean surface, phytoplankton are indicated on a scale from purple (low) to yellow (high). This visualization was created with data from satellites including SeaWiFS, and instruments including the NASA/NOAA Visible Infrared Imaging Radiometer Suite and the Moderate Resolution Imaging Spectroradiometer.
Français : Cycle annuel de l'enneigement et de la végétation : sur la terre ferme, la végétation apparaît sur une échelle allant du brun (végétation faible ou basse) au vert foncé (végétation dense) ; à la surface de l’océan, la densité en phytoplancton figure sur une échelle allant du violet (faible) au jaune (élevée). Cette visualisation a été créée à l'aide de données provenant de plusieurs satellites, notamment SeaWiFS, et d'instruments tels que la suite de radiomètres infrarouges visibles NASA / NOAA et le spectroradiomètre imageur à résolution moyenne.
日期
来源 NASA's Goddard Space Flight Center
作者 NASA's Goddard Space Flight Center

许可协议

Public domain 本文件完全由NASA创作,在美国属于公有领域。根据NASA的版权方针,NASA的材料除非另有声明否则不受版权保护。(参见Template:PD-USGov/zhNASA版权方针页面JPL图片使用方针。)
警告:

说明

添加一行文字以描述该文件所表现的内容
Yearly cycle of vegetation

此文件中描述的项目

描绘内容

版权状态 简体中文(已转写)

文件历史

点击某个日期/时间查看对应时刻的文件。

日期/时间缩⁠略⁠图大小用户备注
当前2017年11月15日 (三) 10:182017年11月15日 (三) 10:18版本的缩略图720 × 360(4.33 MB)OriginalwanaUser created page with UploadWizard

以下页面使用本文件:

全域文件用途

以下其他wiki使用此文件: